Classinsight

Fig. 1: Example of Unit View
ClassInSight is an innovative computer vision-based platform designed to provide real-time analytics for classrooms, empowering educators to enhance their teaching practices through actionable, data-driven insights.
By visualizing instructional data, ClassInSight addresses the complex demands of managing diverse classroom dynamics, particularly for novice teachers. The platform offers continuous, objective feedback, mirroring the insights of human observers while remaining significantly more cost-effective and scalable.
Harnessing advanced sensor data, ClassInSight supports educators in identifying best practices, setting personalized teaching goals, and achieving measurable improvements in instructional quality. By advancing evidence-based professional development, ClassInSight delivers a transformative tool for fostering educational excellence and improving learning outcomes.
Through the Summer Research Education University Program at Carnegie Mellon, I gained extensive experience working in an interdisciplinary lab setting, developing skills in experimental design and effective communication with peers and faculty. Conducting research—from conceptualizing experiments to presenting findings—proved both challenging and deeply rewarding. Continuing my work into the fall, I enhanced the sensor-based training system and refined the study design, culminating in a presentation at Carnegie Mellon’s Meeting of the Minds research symposium with a commitment to advancing impactful, interdisciplinary research.

Fig. 2: Testing the facial recognition algorithm using Kinect sensor system

Fig. 3: Presenting our work at Meeting of the Minds in May 2018
Observational Study
I contributed to the design, execution, and refinement of an observational study focused on implementing a sensor-based dashboard in STEM courses to support higher education teaching assistants. Utilizing design-based research methods and qualitative data analysis, our team introduced a feedback and training system to help instructors reflect on and enhance their teaching practices.
Key Contributions
Data Analysis and Visualization: I collected, interpreted, and visualized data from our classroom sensor system, generating actionable insights for participants.
Curriculum Development: I designed and delivered a curriculum for CMU instructors during the summer session, focusing on goal-setting for professional development. The curriculum emphasized strategies like asking deeper questions and increasing student participation.
Iterative Design: During the fall semester, I expanded the curriculum content and refined its delivery through an online instructional platform. This involved multiple iterations of feedback visualizations and instructional materials, grounded in principles of tailored instruction, adaptive control, and instructional design.
Impact
This work advanced the integration of sensor-based systems in higher education, equipping instructors with tools to reflect on their practices and develop evidence-based teaching strategies. By combining data-driven insights with targeted professional development, the project fostered more effective and engaging STEM instruction.
Data Visualizations
We developed intuitive and impactful visualizations for the teacher dashboard, transforming data into actionable insights to encourage meaningful reflection and improvement in teaching practices.
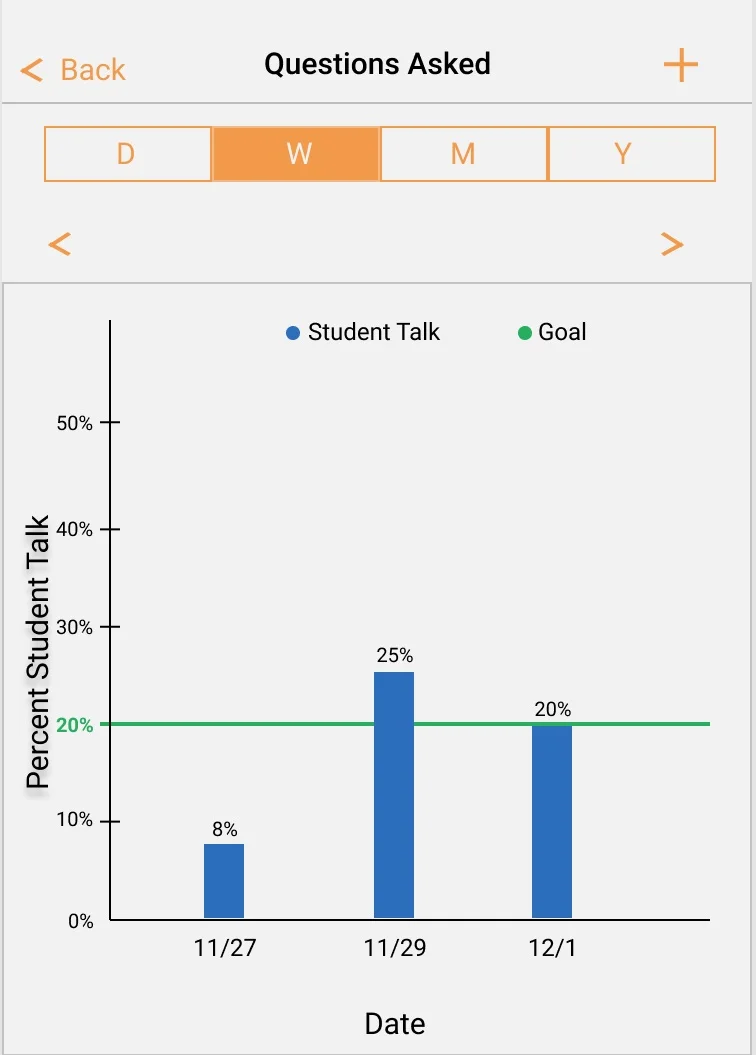
Fig. 4.1: Question Count Visualization

Fig. 4.2: Question Count Visualization
Research Methods
Personal Informatics and Behavior Change Technology: Leveraged data-driven approaches to design technologies that promote and sustain positive behavioral changes.
Design-Based Research: Applied iterative, real-world testing and refinement of tools to ensure practical and impactful outcomes in educational settings.
Learning Science Principles: Integrated evidence-based strategies to enhance learning, focusing on cognitive, social, and motivational factors that drive effective teaching and behavior change.

Fig. 5: Final Poster for Meeting of the Minds in May 2018